
 Counter-Strike 2
 Valorant
 Dota 2
 League of Legends
To show FPS in CS2, enable the developer console and enter cl_showfps 1. The readout appears at the top of the screen. Hide it with cl_showfps 0. For a persistent no-console option, open Settings > Game > Telemetry, then set Show frame time and FPS to Always.
Commands and UI checked 30 August 2026. Commands were checked against the current CS2 registry and UI routes against Valve, Steam, NVIDIA, and AMD documentation. No current local-client build number was recorded. The exact Steam disable label, CS2 readout corner, and non-AMD recording behavior were not tested locally.
Which CS2 FPS Display Method Should You Use?
Use cl_showfps 1 for one immediate number. Use Telemetry for frame time or networking. Choose Steam, NVIDIA, or AMD when placement and hardware data matter.
| Method | Data shown | Placement | Persistence | Capture | Overhead evidence |
|---|---|---|---|---|---|
cl_showfps |
FPS; separate smooth-FPS and server-MS modes | Top of screen; no documented movement control | Not archived | Not locally tested | No fixed CS2 cost established |
| CS2 Telemetry | FPS, frame time, ping, misdelivery, network graphs | HUD position; exact corner unverified locally | Archived settings | Not locally tested | No fixed CS2 cost established |
| Steam Performance Monitor | FPS, graphs, optional CPU, GPU, and RAM data | Position, size, text, saturation, and opacity controls | Steam setting; restart untested locally | Not locally tested | No fixed CS2 cost established |
| NVIDIA App | FPS, FPS 1% Low, hardware and latency data | Defaults top-right; configurable | App setting; restart untested locally | Not locally tested | No fixed CS2 cost established |
| AMD Adrenalin | FPS, frame time, 99th% FPS, stutter and hardware data | Corners or custom coordinates | App setting; restart untested locally | Documented output control | No fixed CS2 cost established |
Use one counter at a time when benchmarking. Different tools can overlap and calculate their numbers differently.
The CS2 FPS Command
Enable the console through Settings > Game > Enable Developer Console, open it with your assigned key, then enter:
cl_showfps 1
Turn it off with:
cl_showfps 0
The current registry promises only a display at the top of the screen. Exact corner, color, size, and movement claims require a current-client test.
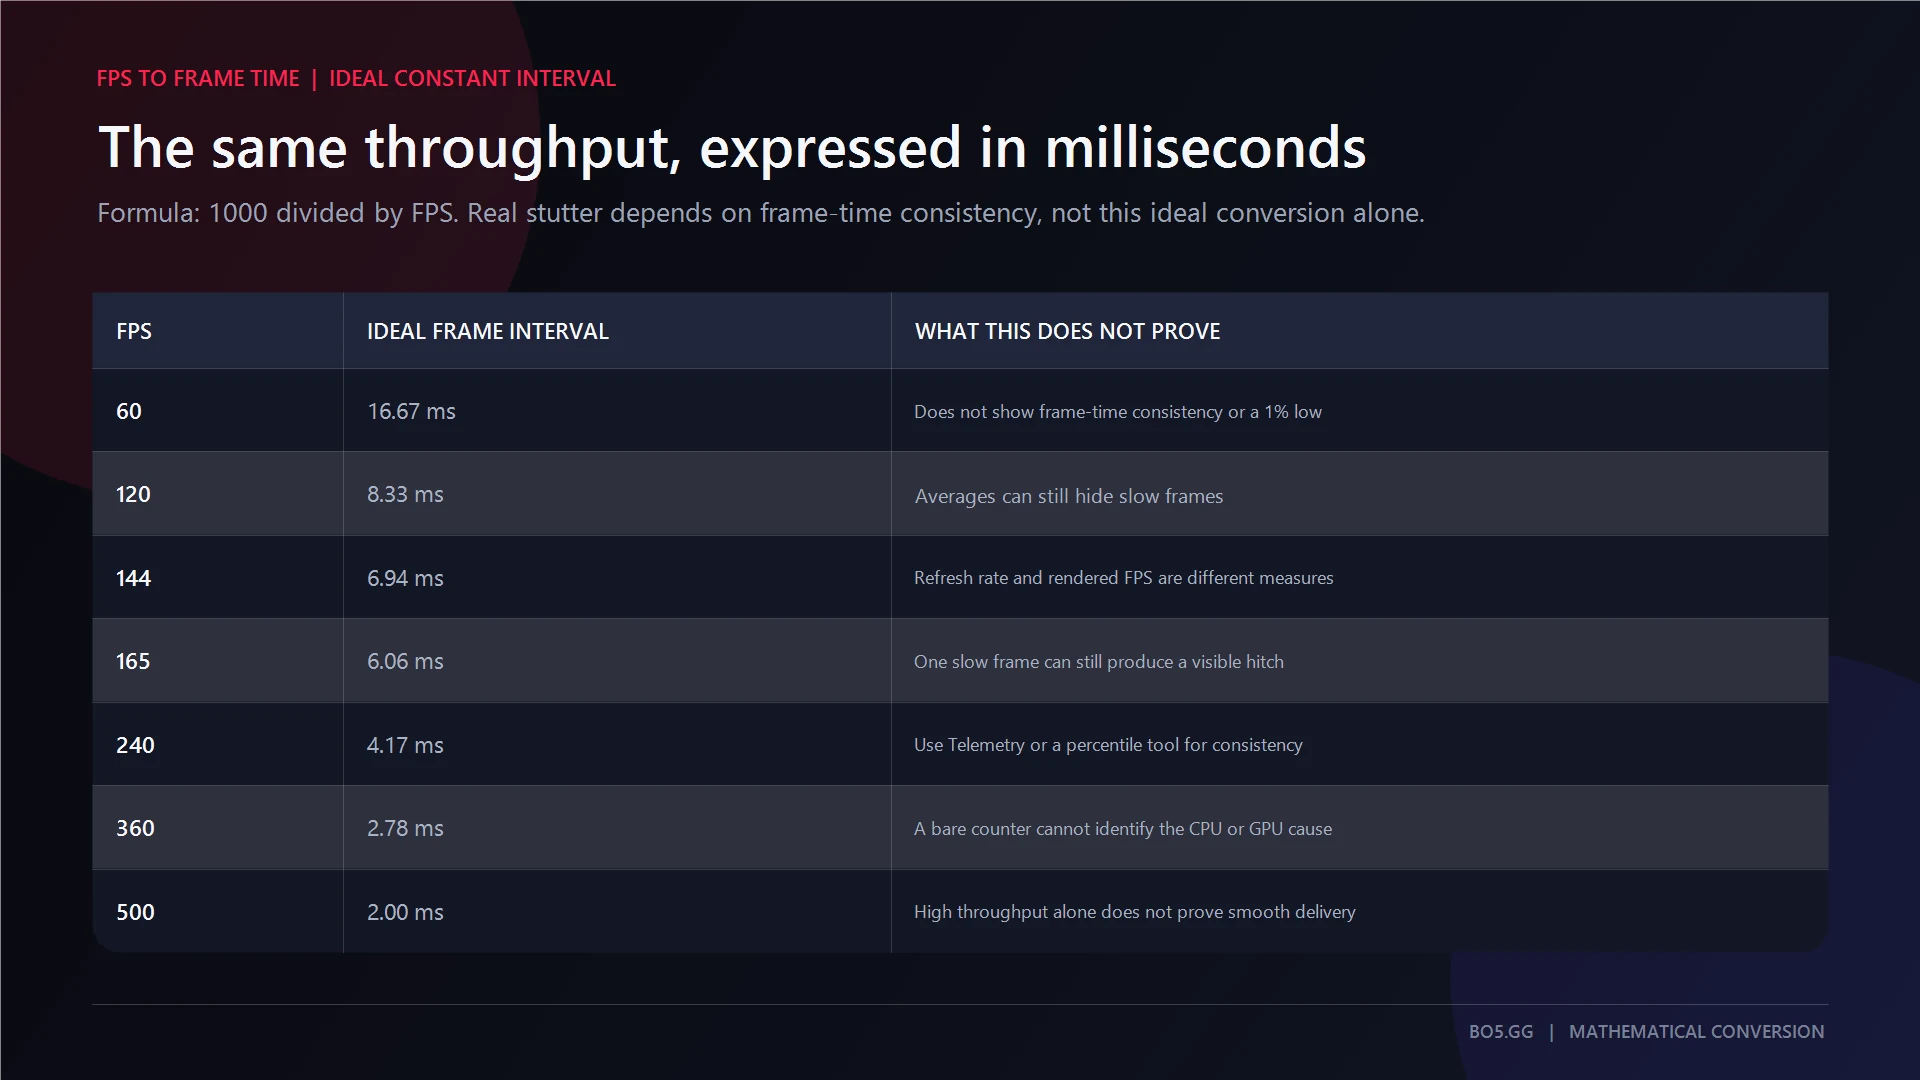
| Command | Verified meaning | Limitation |
|---|---|---|
cl_showfps 0 |
Off | Hides the display |
cl_showfps 1 |
FPS | No frame time, ping, or 1% low |
cl_showfps 2 |
Smooth FPS | Smoothing window is undocumented |
cl_showfps 3 |
Server MS | Not verified as ping or tick rate |
cl_showfps 4 |
Shows FPS and logs to a file | Path, format, fields, and CSV behavior are unverified |
The registry labels cl_showfps 2 as Smooth FPS, but it does not define the smoothing method or window. It should not be described as a min/max display or a 1% low.
Show FPS And Frame Time Without The Console
Use:
Settings > Game > Telemetry > Show frame time and FPS > Always
The console equivalent is:
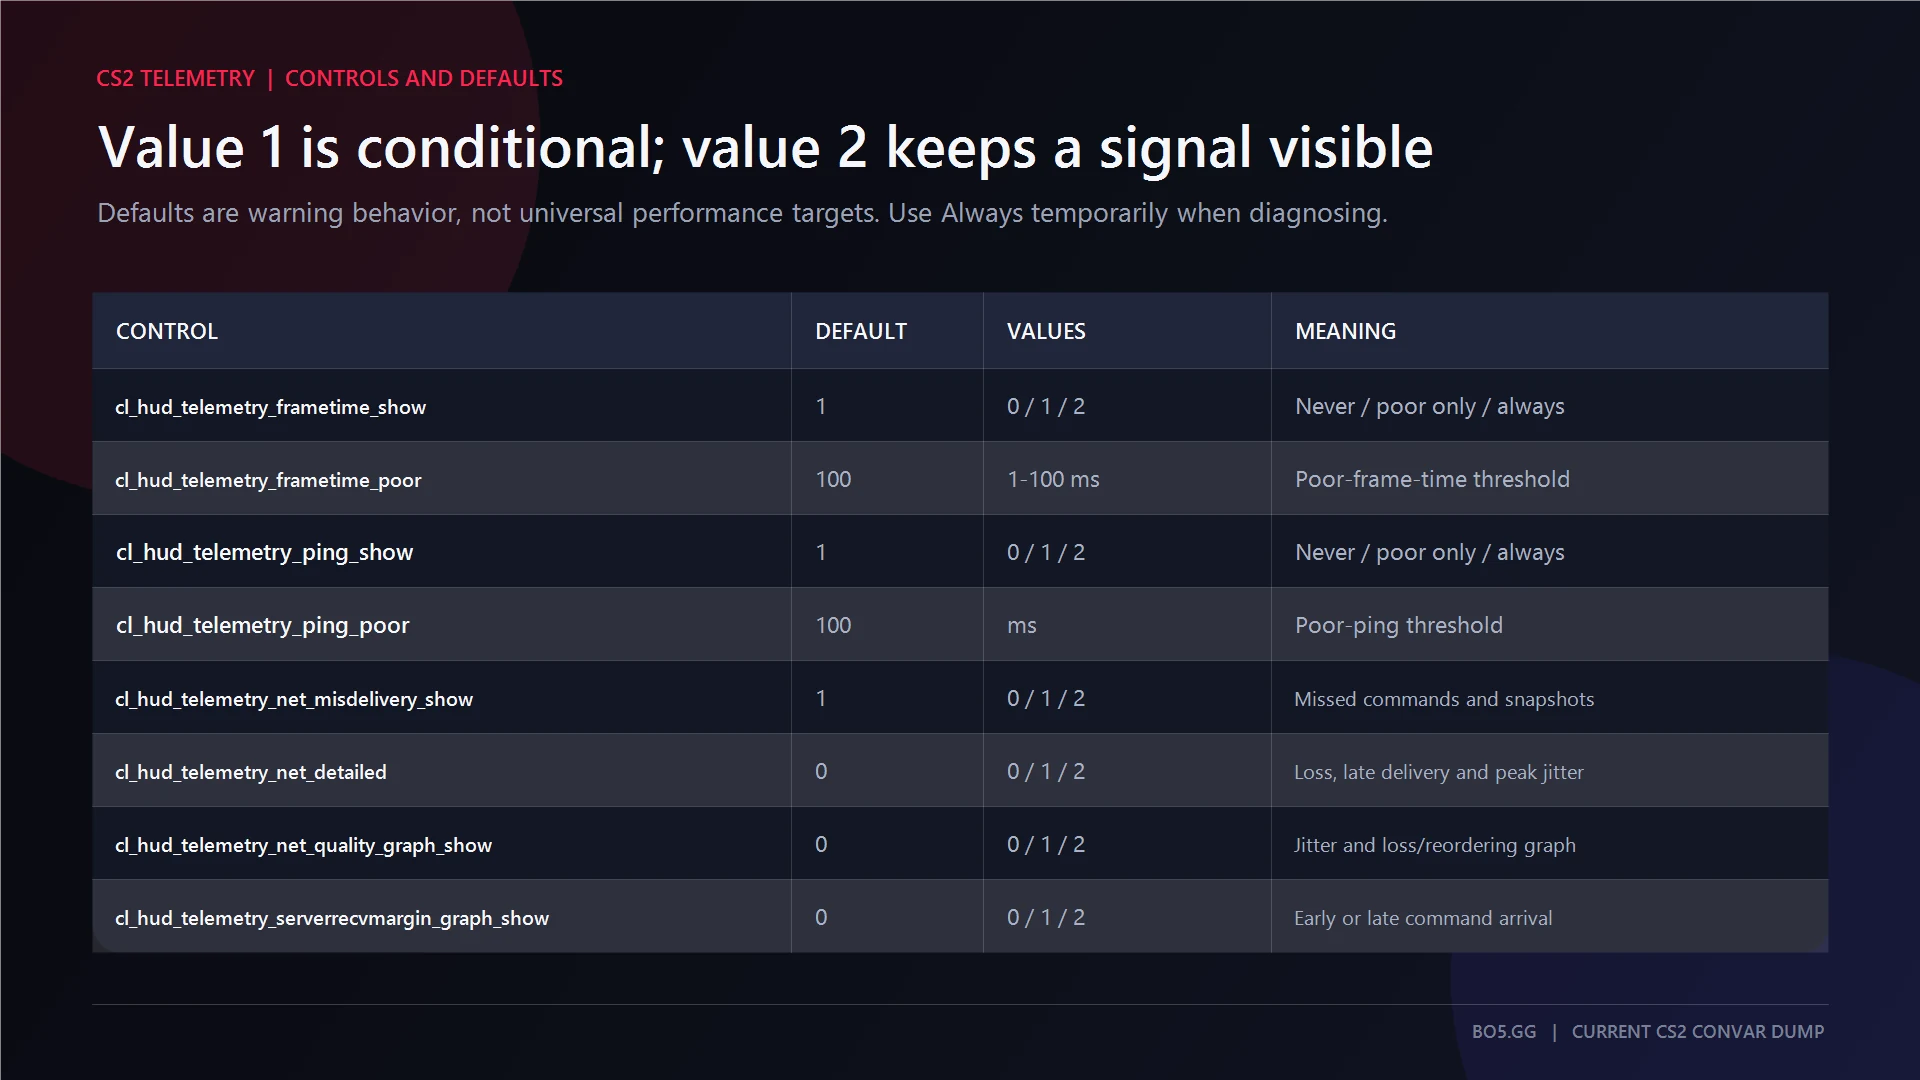
cl_hud_telemetry_frametime_show 2
Telemetry uses 0 for never, 1 for poor conditions only, and 2 for always. Its default is 1, so the display may remain hidden when performance is normal.
For always-visible ping and network-delivery details:
cl_hud_telemetry_ping_show 2
cl_hud_telemetry_net_misdelivery_show 2
cl_hud_telemetry_net_detailed 2
FPS is rendering throughput. Frame time is how long each frame takes in milliseconds. A steady 240 FPS equals about 4.17 ms per frame, but a high average can still feel rough when individual frame times spike.
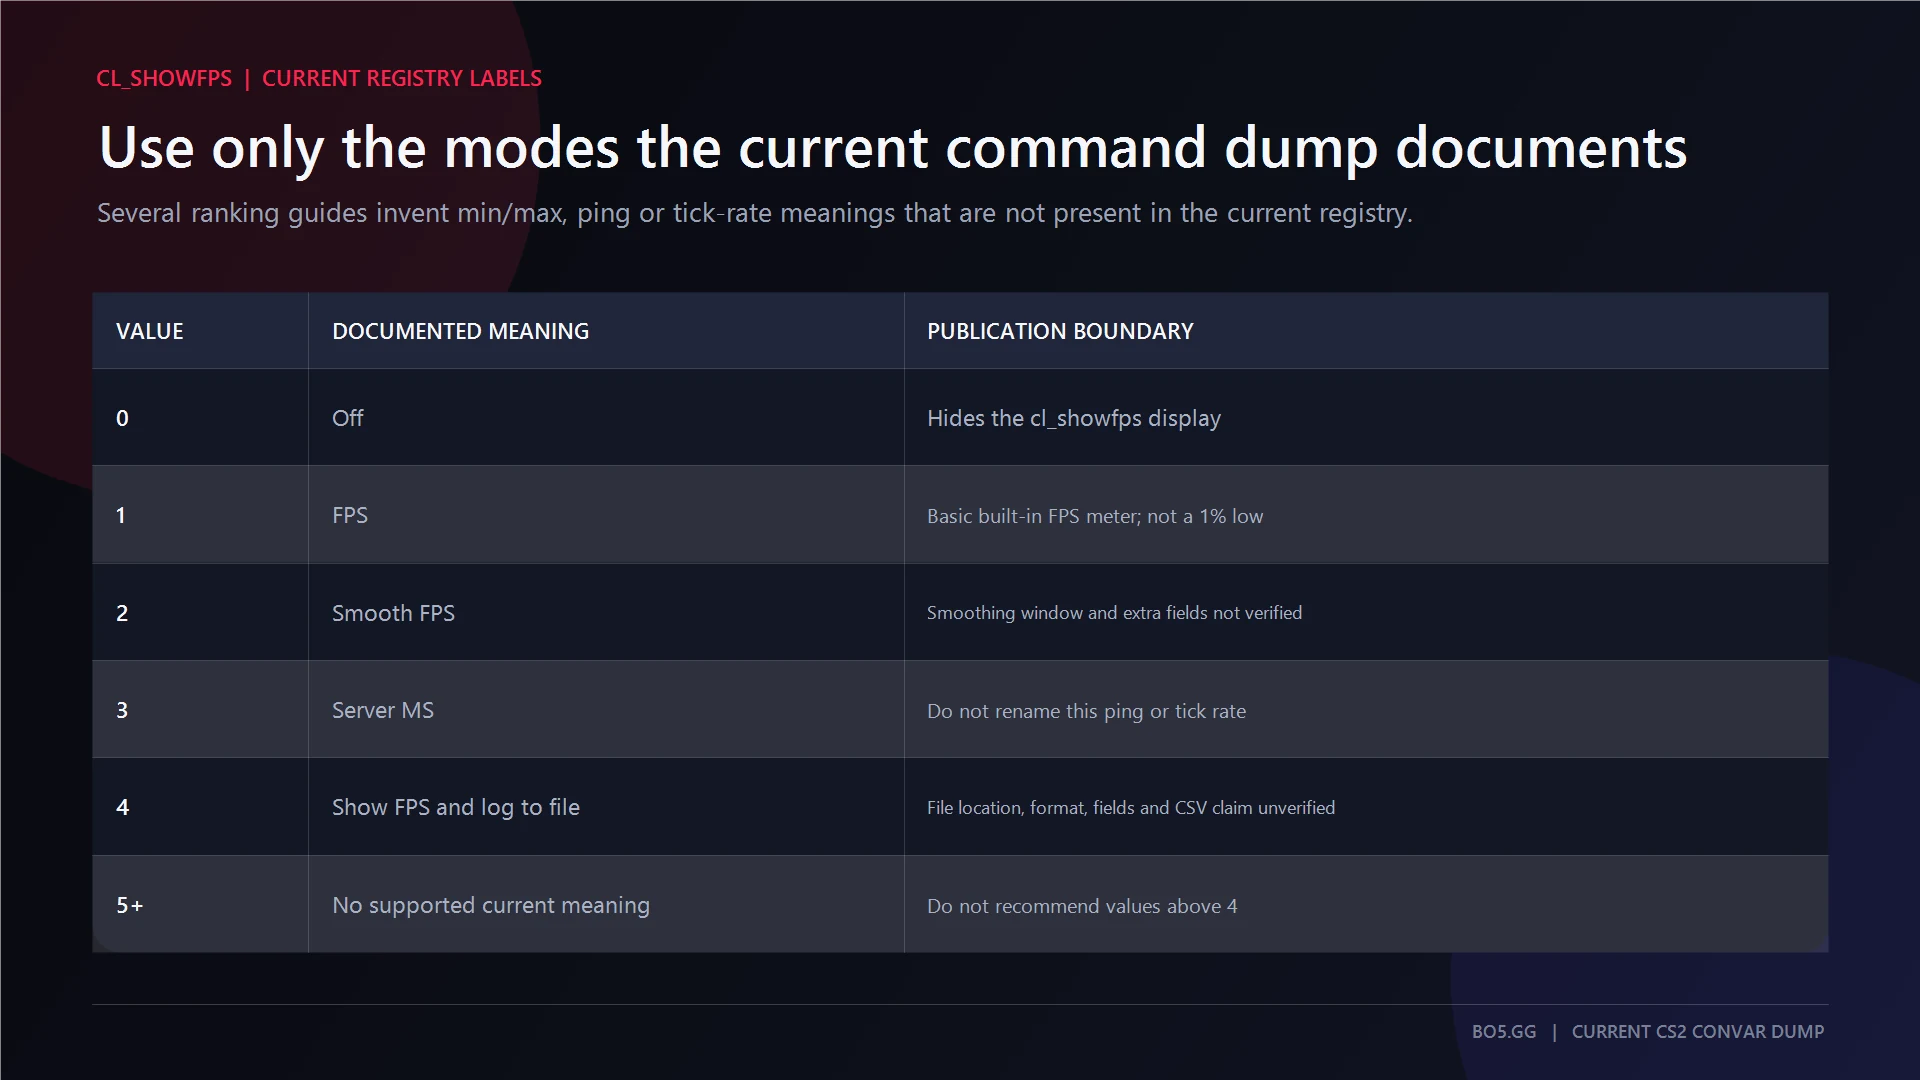
A bare FPS counter does not calculate 1% lows. A 1% low averages the slowest 1% of sampled frames. Ping measures round-trip delay, packet loss means data never arrived, and jitter means arrival timing varied. CS2 misdelivery is broader than raw loss because it covers commands or snapshots missed due to network conditions.
Use Steam Performance Monitor
Steam replaced its old In-game FPS counter route with a configurable Performance Monitor:
Steam > Settings > In Game > Performance Monitor
Its official levels are Single FPS Value, FPS Details, FPS Details, CPU & GPU Utilization, and FPS, CPU, GPU & RAM Full Details. The first is best for a small movable counter; the others add graphs and hardware context.
Steam also provides position, text-size, saturation, and background-opacity controls. Its minimum single-frame FPS is not a 1% low: one is an extreme frame, while the other averages the slowest percentile.
Disable the monitor in the same section. The exact disabled-option label was not captured locally, so this article does not guess whether it currently says “Off” or “None.”
Use NVIDIA Or AMD Overlays
NVIDIA App
Open NVIDIA App > Settings > Features > In-Game Overlay. Press Alt+R to show or hide statistics and Alt+Shift+R to cycle metrics. The display defaults top-right and is configurable through Alt+Z > Statistics > Configure heads up display.
NVIDIA documents a metric explicitly named FPS 1% Low, plus utilization, temperatures, and latency-related data. Press Alt+R again or disable In-Game Overlay to remove it.
AMD Software: Adrenalin Edition
Search Metrics in AMD Software, open Performance Metrics, and enable Show Metrics Overlay. Ctrl+Shift+O toggles it.
AMD shows FPS, frame time, stutter rate, hardware data, and 99th% FPS. Do not rename that metric a conventional 1% low without a documented definition. AMD supports corner or custom placement, size, columns, transparency, and text color. Its Show In Video/Stream Output control determines whether metrics appear in fullscreen output.
No reliable source establishes one fixed CS2 performance cost for any counter. Compare repeated runs with one display and one capture setup.
What Happened To net_graph In CS2?
The old CS:GO net_graph command is absent from current CS2, and no command restores its combined display. Current diagnosis is split across separate Telemetry controls for FPS, frame time, ping, delivery problems, and network graphs.
cq_netgraph is not a current FPS method either. It was a command-queue and network diagnostic, not an FPS counter, and Valve removed it in February 2024.
The closest current network graphs are:
cl_hud_telemetry_net_quality_graph_show 2
cl_hud_telemetry_serverrecvmargin_graph_show 2
The first visualizes jitter and netframe loss or reordering. The second shows how early or late commands reach the server. Disable them by changing 2 to 0.
BO5’s guide to CS2 net jitter and packet loss covers persistent connection symptoms without confusing them with rendering performance.
How To Keep The FPS Counter On After Restarting CS2
cl_showfps is not marked as archived, so do not assume a one-time console command will survive every restart.
For startup execution, add this exact line under CS2 > Properties > General > Launch Options:
+cl_showfps 1
The leading + tells the engine to execute a console command. BO5’s CS2 launch options guide covers the wider syntax.
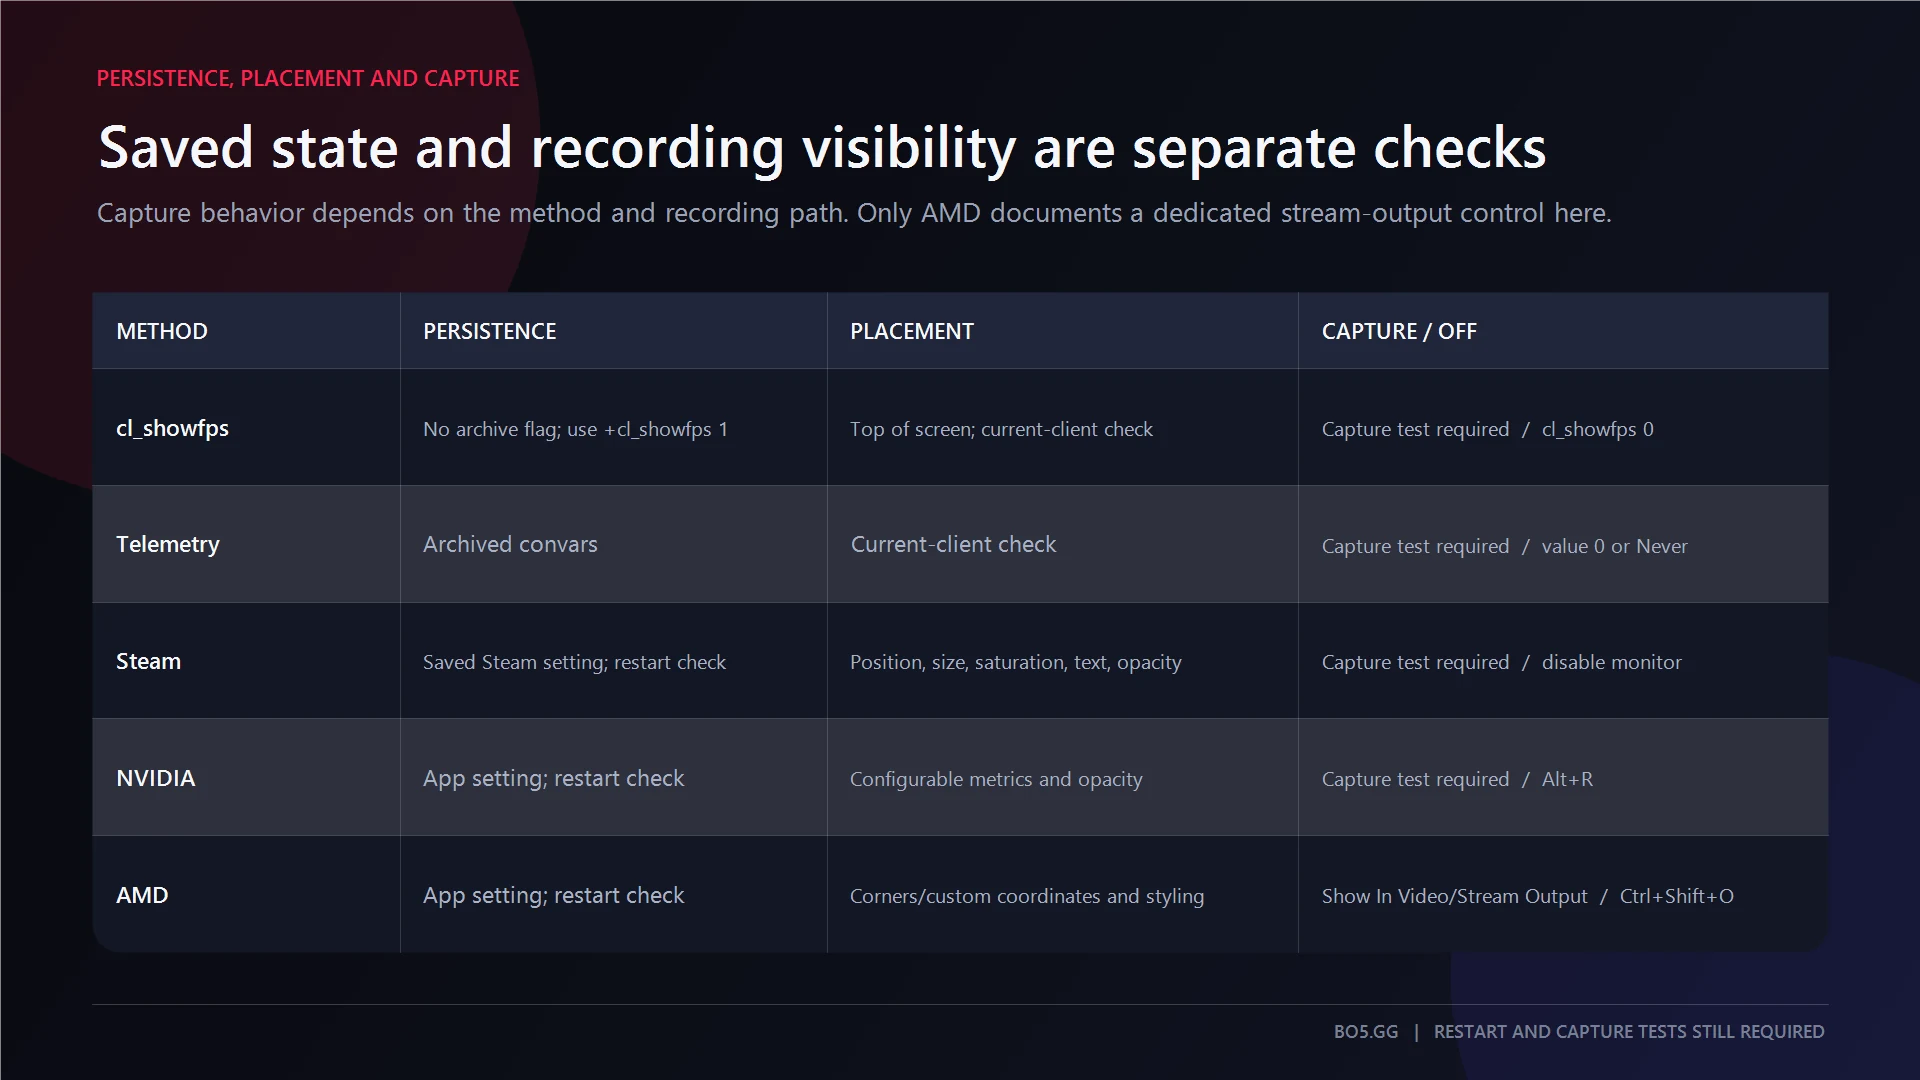
Telemetry is the cleaner persistent choice when you also need frame time or ping because its relevant settings are archived. A CS2 autoexec makes sense only when you already manage several verified startup commands. It is unnecessary for one FPS line, and so is a bind or alias.
If Your CS2 FPS Counter Is Not Showing
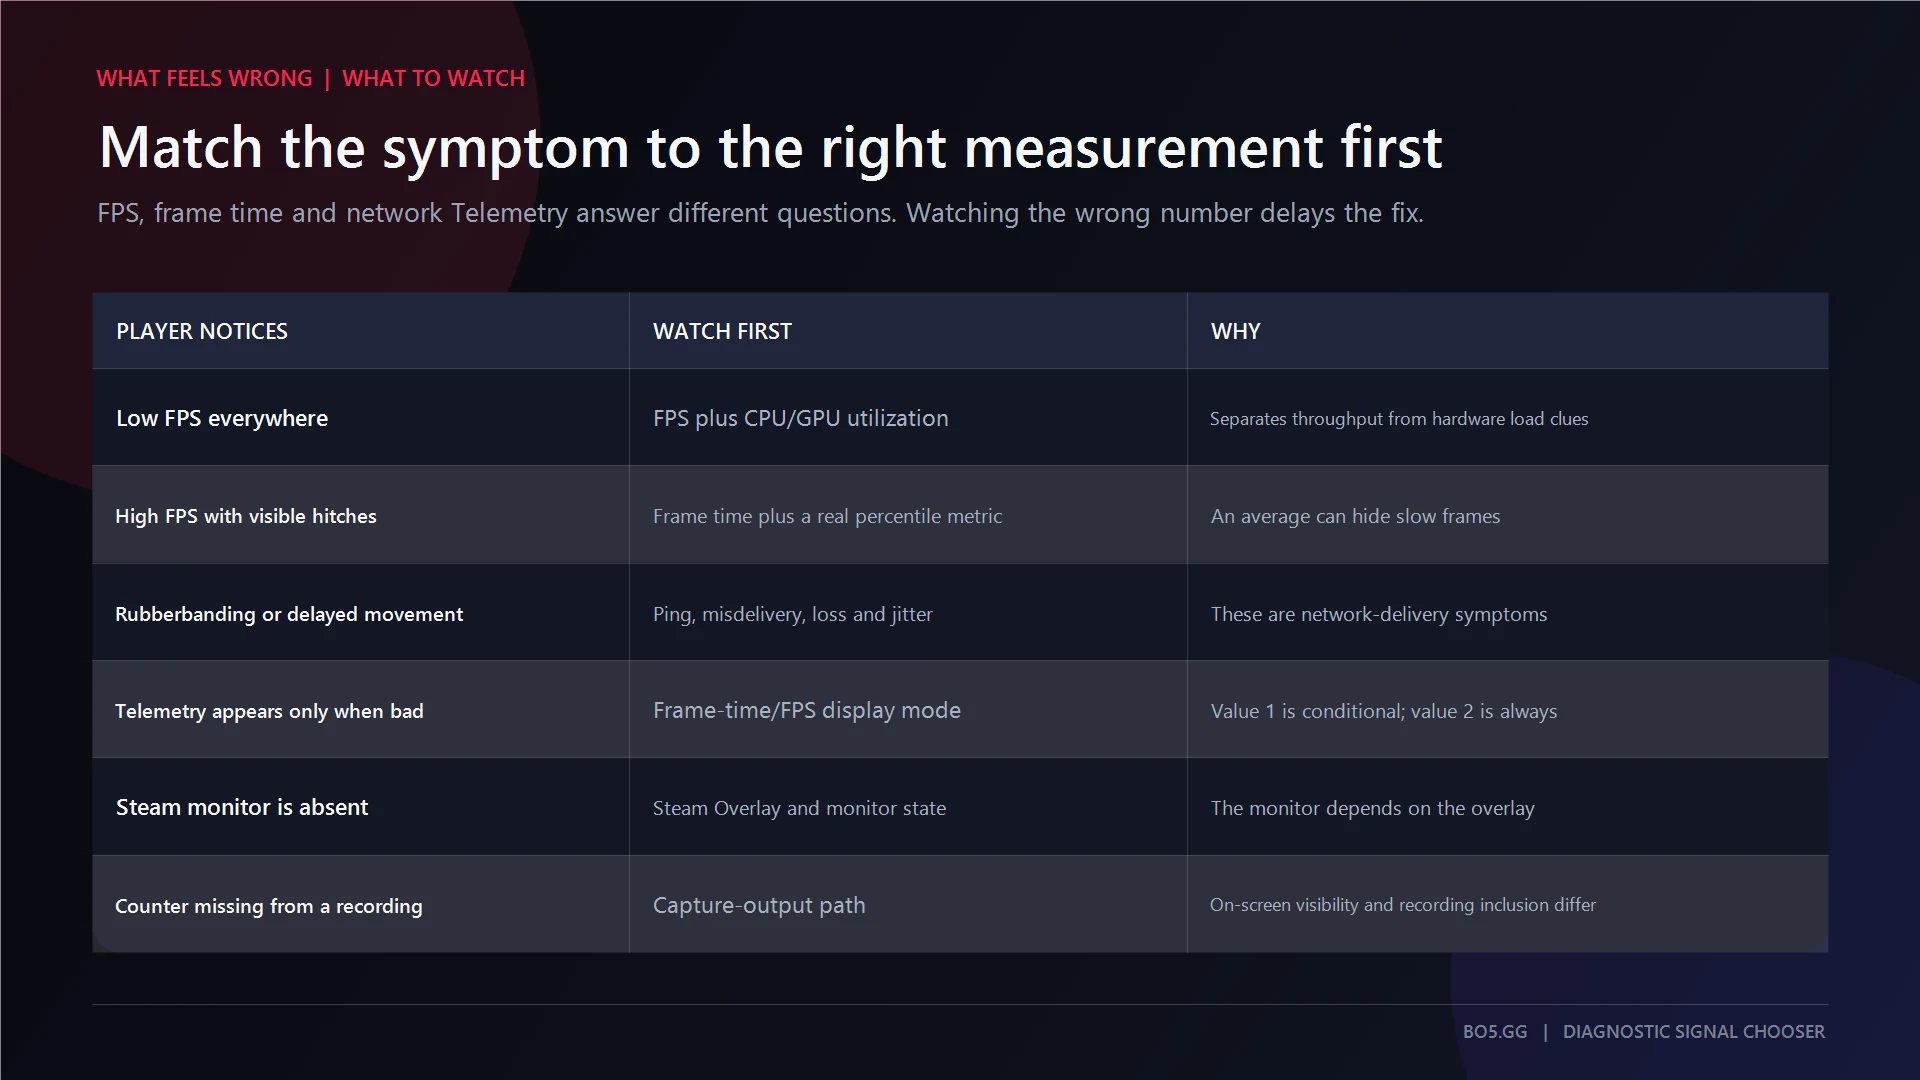
Check these in order:
- Load an offline map or match instead of testing only in the menu.
- Enable one counter at a time to remove overlaps and hotkey conflicts.
- Set Telemetry to Always, or enter
cl_hud_telemetry_frametime_show 2. - Enable Developer Console under Settings > Game, then enter
cl_showfps 1. - Enter
cl_showfpsalone to inspect its current value. - Fix launch syntax to
+cl_showfps 1, including the plus sign. - Enable Steam Overlay globally and for CS2 before using Performance Monitor.
- Confirm NVIDIA In-Game Overlay or AMD Show Metrics Overlay is enabled.
- Restart only the relevant game or app first.
- Verify CS2 files through Steam if only built-in methods remain broken.
Do not disable security software, edit the registry, delete every config, or reinstall drivers just to restore an FPS counter.
How To Turn Every Counter Off Or Reset It
cl_showfps: entercl_showfps 0.- Telemetry: set each menu control to Never, or use
0for its convar. - Steam: disable Performance Monitor under Steam > Settings > In Game.
- NVIDIA: press
Alt+R, or disable In-Game Overlay. - AMD: press
Ctrl+Shift+O, or disable Show Metrics Overlay.
To clear the main Telemetry displays and graphs:
cl_hud_telemetry_frametime_show 0
cl_hud_telemetry_ping_show 0
cl_hud_telemetry_net_misdelivery_show 0
cl_hud_telemetry_net_detailed 0
cl_hud_telemetry_net_quality_graph_show 0
cl_hud_telemetry_serverrecvmargin_graph_show 0
What To Check After You Can See Your FPS
Low FPS points toward rendering or hardware load. High FPS with frame-time spikes points toward pacing. Stable FPS with rubberbanding or network warnings points toward ping, loss, jitter, or misdelivery.
When rendering is the problem, compare one change at a time using the best CS2 settings for FPS. Keep the map, resolution, counter, capture method, and test route unchanged.
Frequently Asked Questions
How Do You Show FPS In The Top Right In CS2?
Use Steam Performance Monitor or NVIDIA App rather than cl_showfps. Steam offers position controls, while NVIDIA defaults to the top-right. The exact current corner of CS2’s built-in cl_showfps and Telemetry readouts was not independently verified in a local client.
Does Showing FPS Lower Your FPS In CS2?
No universal penalty is established. Overlays and capture paths can add work, but a fixed percentage from another PC is not reliable. Test one counter at a time, keep the recording setup unchanged, and compare repeated runs.
Why Does My FPS Counter Disappear After Restarting CS2?
cl_showfps is not marked as archived. Use +cl_showfps 1 in Steam launch options, or use Telemetry when you also want frame time or ping. An autoexec is only worthwhile when it already manages several commands.
What Is The Difference Between FPS And Frame Time?
FPS counts completed frames each second. Frame time measures how long each frame takes. A high average can still feel uneven when individual frame times spike, which makes Telemetry’s combined display more useful for diagnosing stutter than a bare counter.
Can You Show Ping In CS2 As Well?
Yes. Set the ping display to always visible under Settings > Game > Telemetry, or enter cl_hud_telemetry_ping_show 2. Ping measures network delay, so compare it with misdelivery, loss, and jitter rather than treating it as an FPS value.
Sources And Verification
- Current extracted CS2 convar registry for command meanings, ranges, and archive flags.
- Valve’s 12 February 2024 update for the removal of
cq_netgraph. - Valve Source 2 Telemetry support for metric definitions.
- Steam launch-options support and Valve Developer Community command-line syntax for startup execution.
- Steam Performance Monitor for monitor levels and controls.
- NVIDIA overlay support and NVIDIA App metrics.
- AMD Performance Metrics support for metrics, placement, hotkeys, and output controls.
Written by

Muhib Nadeem
21 published articles
CS2 writer and BO5 editor covering Counter-Strike guides, rankings, skins, and performance fixes.
Recommended posts

August 30, 2026
FACEIT Ranks and Elo Explained: Every Level in CS2
Current FACEIT CS2 Elo thresholds, every skill level, Season 9 soft-reset rules, Challenger status, party modifiers, leavers, and Premier limits.
August 30, 2026
How to Start Private Matchmaking in CS2
Choose the correct CS2 private-play route, start a ten-human Private Matchmaking pool, preserve teams, and diagnose lobby or server failures safely.

August 30, 2026
How to Unlock Premier in CS2
CS2 Premier requires Prime Status and Profile Level 10 on the same account. This guide separates access, rating calibration, XP planning, and safe lock troubleshooting.